A nation divided by housing tenure
Posted: December 14, 2012 Filed under: Buy to let, Housing market, Mortgages, Private renting, Social housing | Tags: Census Leave a commentThis week’s Census reveals a historic shift from owning to renting as the nation adjusts to new housing realities. That much is obvious but there are some significant trends behind that headline number too.
The results for England and Wales show private renting has risen from 9 per cent of households in 2001 to 15 per cent in 2011 and that home ownership has fallen from 68 per cent to 64 per cent over the same period.
However, that simple two-way split misses what has happened beneath the surface. Tenure is now split roughly three ways between outright ownership, owning with a mortgage and renting (itself split evenly between social and private renting). Many people were watching to see whether private renting would overtake social renting (for the first time since 1961) but this did not happen unless you include all forms of private renting, including those who rent from an employer or live rent-free.
So the more significant change for me is the fact that there are now more renters (private and social) than people buying with a mortgage. Between 2001 and 2011, mortgaged home ownership fell from 39 per cent of all tenure to 33 per cent. The total number of households buying with a mortgage has fallen by 749,000 over the last ten years from 8.4 million to 7.6 million. However, if mortgaged ownership had maintained its 2001 share of a rising number of households, there would now be 1.4 million more home owners on the housing ladder.
It’s also owner-occupation rather than home ownership that has fallen. While this is not fully recorded in the Census, there are plenty of individual home owners who own more than one home. That reflects not so much the ownership of second and holiday homes as the irresistible rise of buy to let. At the time of the last Census in 2001, CML statistics show that were here were 185,000 outstanding buy-to-let mortgages. By 2011 there were 1.4 million. Generation Rent has its counterpart in an older Generation Own.
Within the national total, there is also huge variation between areas on housing tenure. Here are some Top 10 tables to show what I mean:
Highest % owned outright

As might be expected, there is a heavy preponderance of retirement destinations in the South West here. Other places outside the south of England in the top 20 were Derbyshire Dales, Powys, Ceredigion, Eden and Wyre.
Lowest % owned outright
It’s no big surprise to see the bottom places dominated by inner London boroughs. Norwich and Liverpool are the only other places outside the capital in the top 20.
Highest % owned with a mortgage
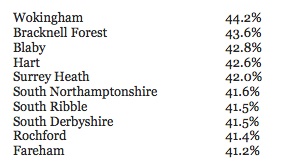
Excluding shared ownership
These are the real heartlands of the home ownership dream and six out of the top 10 are in the South East outside London. In another 12 areas the proportion of households buying with a mortgage is above 40 per cent.
Lowest % owned with a mortgage

Excluding shared ownership
Inner London dominates the list of areas where fewer than one in five households are buying with a mortgage. Other places in the bottom 20 outside London are West Somerset, Cambridge, Manchester, Oxford, Norwich, Ceredigion. In all of these people buying with a mortgage make up less than 25 per cent of households.
Highest % of home ownership
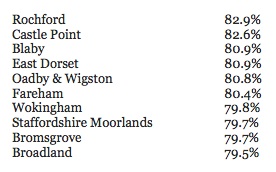
Excluding shared ownership
Add the previous two categories together and these are the top 10 areas for home ownership. The highest in London is Havering with 73.7 per cent.
Lowest % of home ownership

Excluding shared ownership
At the other end of scale, all of the top 10 places with lowest combined ownership are in inner London, with the rate below one in four households in Hackney and Tower Hamlets. Areas in the bottom 20 outside London are Manchester, Isles of Scilly, Norwich and Nottingham.
Highest % of social renting
Excluding shared ownership
It’s no surprise to see many of the areas with lowest home ownership also on the list with the highest proportion of social renting. There are four other areas where social renting is above 30%: Manchester, Harlow, Lewisham and Hammersmith & Fulham.
Lowest % of social renting

Excluding shared ownership
Similarly high ownership often correlates with low social renting. There are another 21 areas where the proportion of social tenants is below 10 per cent.
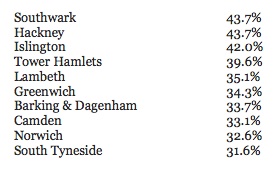
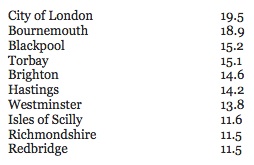
Highest % of private renting
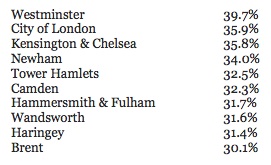
Excludes households living rent-free but includes homes rented from a relative or employer as well as those rented from a landlord or letting agency.
Tower Hamlets and Camden are in the top 10 for both social and private renting. Newham takes fourth place behind more affluent boroughs, perhaps explaining why the local authority is so keen to regulate private landlords. However, six of the areas with the lowest proportion of households buying with a mortgage also make this list.
The only other area with a private renting rate over 30 per cent is Bournemouth. Other areas making the top 20 outside London are Isles of Scilly, Brighton & Hove, Hastings, Manchester and Oxford.
Lowest % of private renting

Excludes households living rent-free but includes homes rented from a relative or employer as well as those rented from a landlord or letting agency.
Alongside these ten areas with the lowest rate of private renting there are another nine with a rate below 10 per cent. However, it’s a reflection of the sector’s meteoric rise that the average rate for the whole country on the same basis was just 12 per cent in 2001. As with the top 10 areas for private renting, this list includes a mixture of areas with high levels of social renting and high levels of home ownership.
Finally, here are two tables illustrating the growth of private renting relative to social renting and buying with a mortgage. The figures show the percentage point gap between them.
Top 10 with PRS higher than social renting (% point gap)
In another 12 areas the gap between private and social renting is more than 10 percentage points
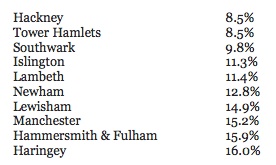
Top 10 with PRS higher than owned with mortgage (% point gap)

This list perhaps best illustrates the areas where potential buyers have been priced out of the market by house prices and the mortgage shortage. All but one are in London but they are not just the prime bits of the capital. The others in the top 20 outside London are Manchester, Oxford, Cambridge, Bournemouth and Hastings. These areas are the frontline of Generation Rent – but it is getting longer all the time.
For a handy visualisation of the Census data including on housing tenure, see the Guardian’s Data Blog.
For more on the housing implications of the Census – and the potential housing costs timebomb of high rents and falling home ownership – see this post on my blog for Inside Housing
